IELTS Task 1 Diagrams Questions
Hi I’m Jonathan.
I’m going to run through answering an IELTS Diagram question. Following these tips would give you a high Task 1 band score.
If you follow this post, then you can apply the same principles to other diagrams, as well as other IELTS Task 1 questions
Before you get started with IELTS Diagrams, look at these articles first.
If you are familiar with the content, skip to the next section.
The key to writing about Diagrams is noticing the number, sequence and the order of stages.
You then need report, as much in your own words, what happens in each stage and describe how each stage is important by paraphrasing the task.
For this type of essay it is standard to write a three or four paragraph report, namely
An Introduction,
An Overview
and one or two body paragraphs.
IELTS Writing Task 1: Describing a Diagram
Problems with IELTS Diagrams
IELTS Diagram questions are very visual. They may seem easier to answer than other formats.
They are less common than charts, graphs or tables, so students often prepare less for these type of tasks.
Always be prepared for any type of IELTS questions!
The good news is the preparation won’t take as long as you might think.
Diagrams follow the same format as any IELTS Task 1:
This is
- Introduce the diagram
- Give an overview of the main point/s (necessary for Band 6 and above)
- And provide the detail
This post will explain:
- Examples of diagram questions
- The tried and tested method for answering any diagram question
- How to write the introduction
- How to write a ‘great’ overview
- How to write about the detail in sequence
- The commons mistakes IELTS students make
What is an IELTS Diagram Question?
These types of question can be divided into two types: natural cycles and man-made or industrial processes.
Official IELTS practice questions have featured natural cycles such as the life cycle of frogs, moths and butterflies, the natural water cycle or how cows produce milk for their calves.
In contrast, other practice questions have included man-made processes such as how coffee, tea or leather is made, bricks are made or a satellite signal is transmitted and received.
More good news is that the same skills and principles can more or less be applied to both man-made and natural cycles.
Let’s consider a typical question first.
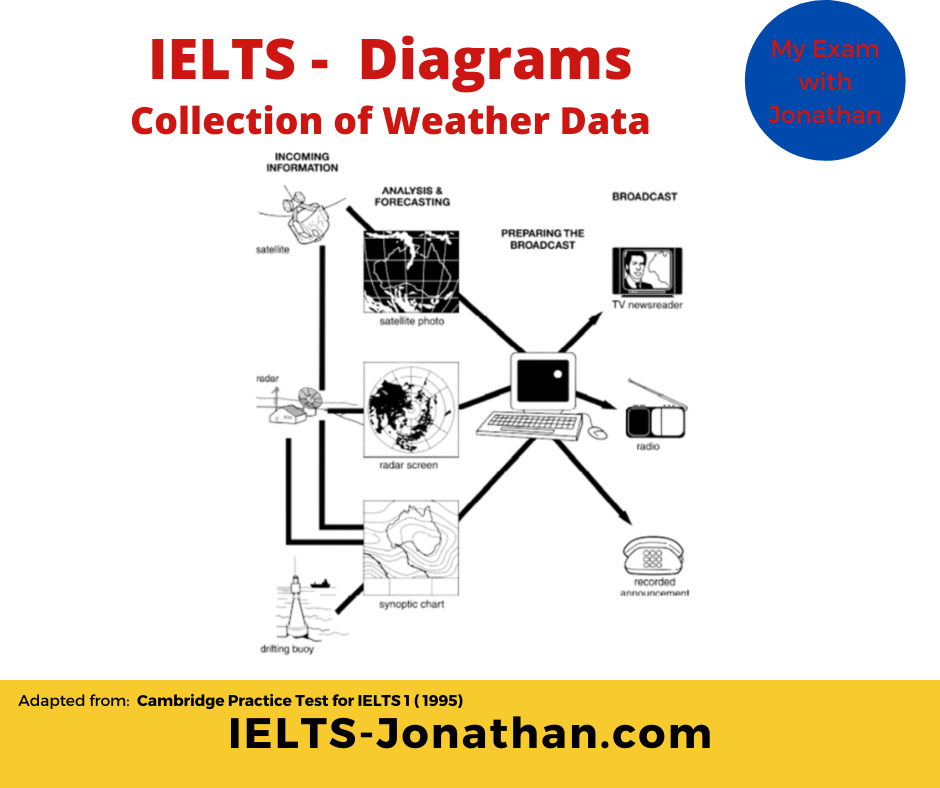
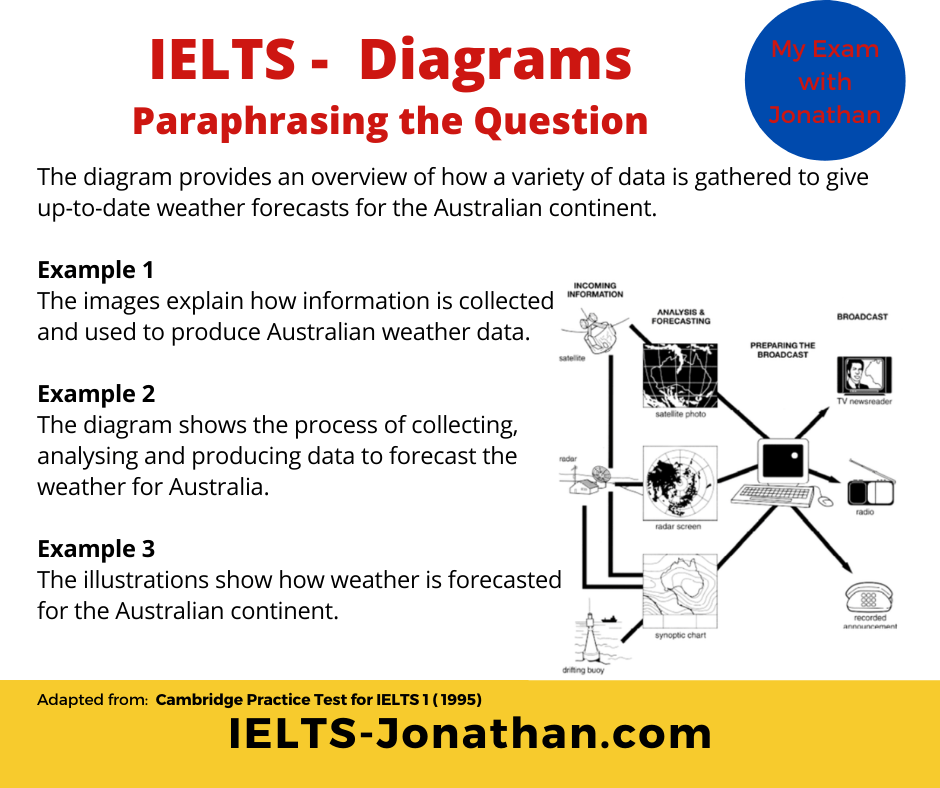
Here is the diagram we are going to use.
A Good Teacher’s Guide to IELTS Planning.
A good IELTS teacher will highlight the need to understand the task quickly and plan an answer quickly too.
You only have 20 mins to write your report.
You can do this like so:
Get an overall visual understanding of the diagram
- Paraphrase the question
- Consider an overview
- Divide the diagram into parts and report
- Include time to proofread your writing
Gaining an overall understanding of the illustration
A diagram has a number of stages. These may time ordered or sequenced. Start at the beginning, try and understand the number of stages or sequences.
You may need to describe stages happening simultaneously or a different stages in the diagram.
In the example above, it is not so obvious!
There appears to be three kinds of information that is gathered and used by a computer and then, there are three ways in which the information is processed and used.
There also appear to be a number sequences that happen at the same time.
It’s quite a challenge to write about something you have never seen, so it is important that you study the diagram and gain an understanding before you start writing.
Don’t worry, it doesn’t need to be perfect, you only have 15 minutes and just need to notice the main features and report them in an accurate way.
TOP TIPS for understanding
- Identify if there is beginning and an end
- Is it a circular process or linear?
- Count the number of stages?
- Is it natural or a man-made?
- Is anything added or taken away?
- What is the function of each stage?
- Is there a relationship between these stages?
- Is there a product/output at the end?
By answering these questions you will have already started planning your essay
Good News – Remember the IELTS task is not there to trick you, and you won’t be given a complicated process to describe. Your task is to report effectively and accurately.
Introduce the Diagram
Top Tip
As with any Task 1, you can begin by paraphrasing sentence (1)
This is the rubric or instructions.
Paraphrasing is a task that is worth learning to do well, and a good knowledge of paraphrasing will also help you in the Reading, Listening and Speaking part of the test.
Simply put, paraphrasing for IELTS means using different words and/or word order so the original meaning remains the same.
In order to remain the same, different words need to be synonyms, so man, male and person have a similar meaning, they are synonymous, but man, male, person and girl are not all synonymous.
As you can see, all the information in the three sentences has been taken from the question, but it has not been copied.
If you do copy directly then those words are not used towards the word count and you will fail on TASK ACHIEVEMENT.
You need to write it in your own words.
In any Academic Task 1 question you can rewrite (paraphrase) the questions and this will be the first paragraph.
Well done. 🙂 Let’s move on!
Now consider the next section, the Overview.
Overview of the Process
The ‘public band descriptors’ state that to achieve a Band 6 or above for ‘task response’ the student must provide an overview in a Task 1. Without one, you are less likely to get a high score.
If you started planning at the beginning then writing a good overview will be a lot easier near the end.
Remember, the questions I’ve already asked you to consider.
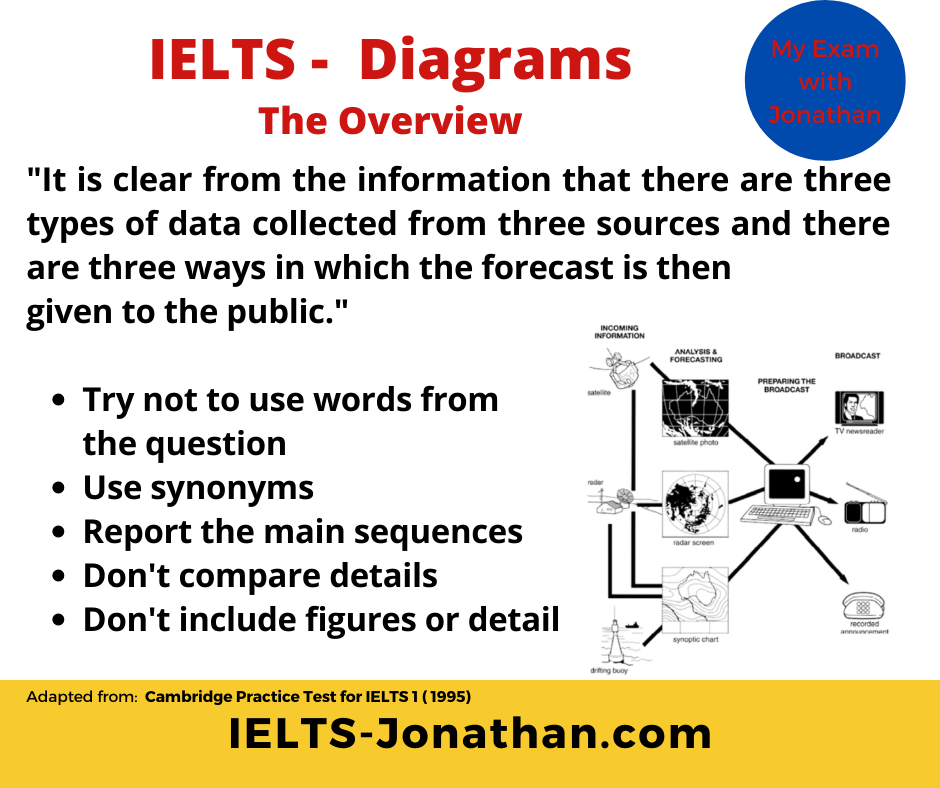
These should be sufficient to provide the 2 sentences you need to construct the basic overview.
Recap:
- Is there a beginning and an end?
- Circular process or linear with a start and a finish?
- Number of stages?
- Natural or a man-made process?
- Additions to the process?
- What is produced at the end
An IELTS diagram is different to a chart or table as there aren’t usually any key changes or trends to identify.
So, as there are no trends to comment on, you could mention, for example, the number of stages in the diagram and how it begins and ends instead.
Providing the Detail
Now that you have completed paraphrasing the question and given the overview, the next stage is to explain the IELTS diagram in detail.
You can do this by:
- Stating what each stage does
- Is there an input or output?
- Is something added or taken away?
- Is there a relationship between stages?
Before you do this you need to consider the most suitable language that reflects the sophistication of the task.
Consider the most suitable language
In order to describe the process well there are two key aspects of language to be considered. These are sequencing and choice of grammar.
1) Time Connectors
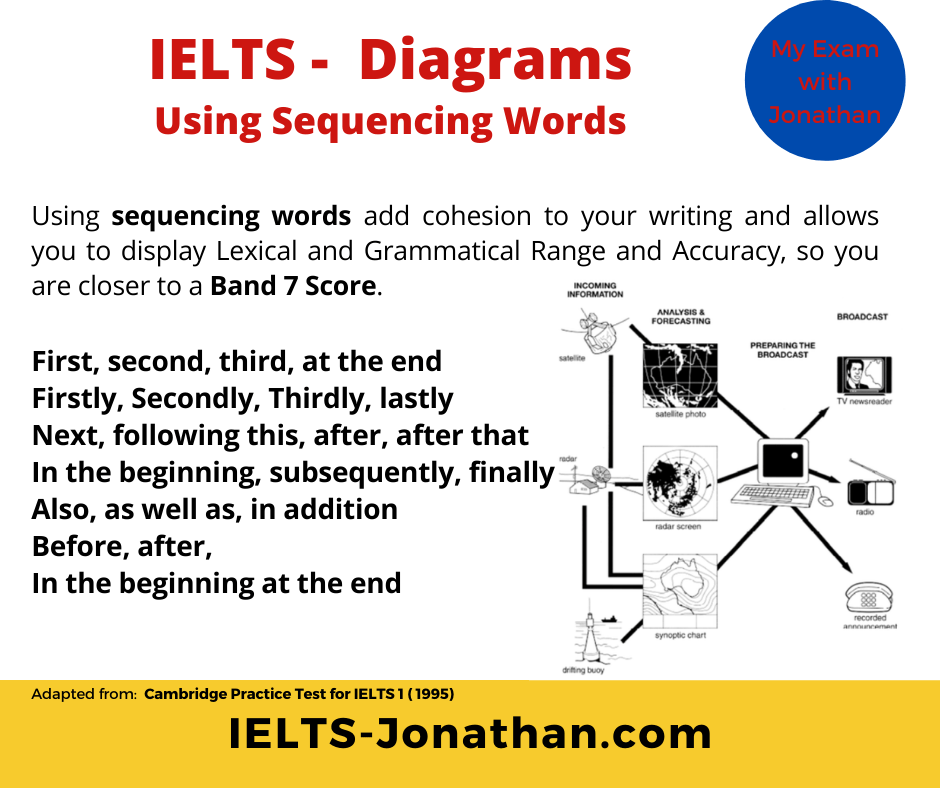
You may need to describe series of events, for example, one taking place after the other, to connect your stages, you should sequence them using suitable ‘time connectors’.
By using these well, your writing instantly becomes more logical, cohesive, sophisticated and most importantly, more impressive to the examiner.
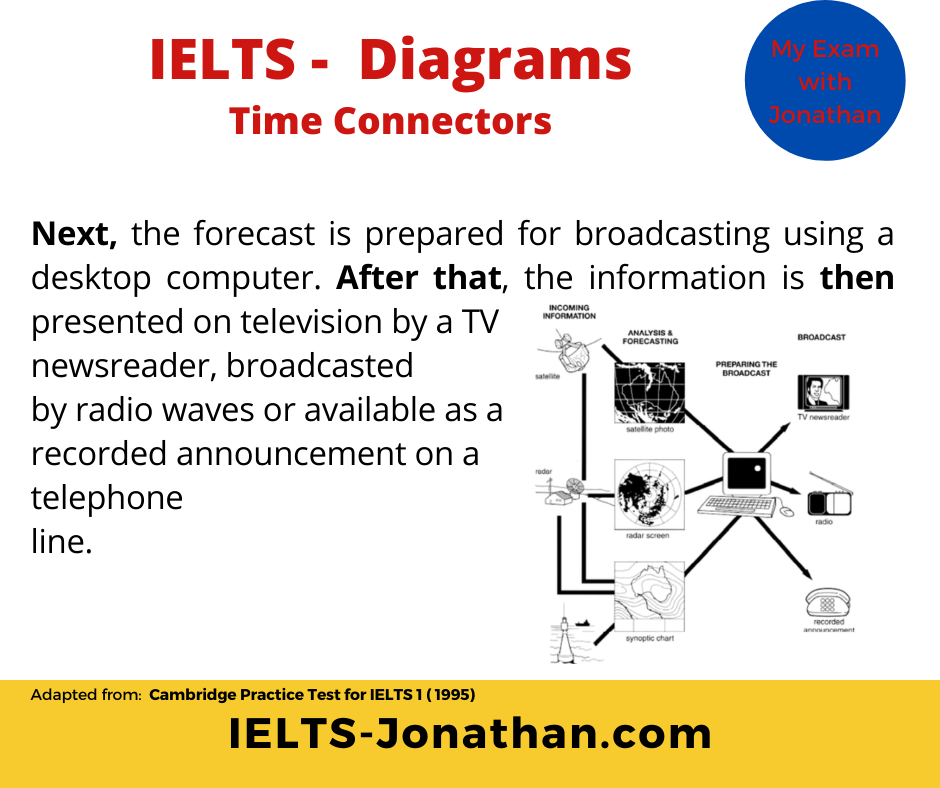
Here is my sample answer with the time connectors highlighted that simply describe from the start to the end of the process.
Other examples of sequencing Time Connectors are:
2) Passive Tense
When we describe an IELTS diagram, the focus is often on the activities in the process rather than the person.
So to describe the activities, use passive and not active grammar.
If you need to know more about the Passive voice you can read the review below, but the good news is
- The IELTS task will provide most of the verbs that you need to use
- Using the passive will avoid using the words as they appear in the text
- You only need to use the passive in the present simple tense – that’s the Present Simple Passive
Most sentences use this structure:
- Subject + Verb + Object
Change
- A satellite collects weather pattern images. Weather patterns in the form of images are collected
In this active voice the satellite does the verb i.e. “the satellite is doing the collecting”.
In the passive voice,
- the object (weather patterns) becomes the subject,
- and the subject (the satellite) becomes the object.
- and the verb ‘to be’ and the past participle (or Verb 3) is also added.
Compare:
A satellite collects weather pattern images.
Weather patterns in the form of images are collected
The second example is far more appropriate for the IELTS Diagram question and far more sophisticated in choice of language.
Here’s my example. I’ve highlighted the passives in the text.
Varying your language
One final tip for a higher score is variation in language.
Occasionally, it may be appropriate just to use the same language that you are given in the IELTS process diagram to describe it, but you should try to vary it.
You may be able to use nouns from the diagram as your verbs.
For example, the noun broadcast near the end of the process becomes:
broadcasted by radio waves….
Is is okay to use ‘words’ from the question?
You may find you struggle to transform some verbs to nouns or think of synonyms for particular words.
Sometimes it’s ‘okay‘ to use words from the question because a word is ‘so‘ specific to the question, that an alternative cannot be used.
Take the word ‘buoy‘ for example.
My definition of this is
a plastic or rubber positioning device that floats on the surface of water, used for maritime navigation, position or measurement.
I don’t believe there is a suitable alternative I can use, it’s content specific.
Using this word from the question, would not penalise my writing.
Common Errors
A very basic error seen in Task 1 introduction is basic verb agreement.
Look at the two genuine examples below.
The diagrams shows
The diagram show
In both examples, it is unclear about the number of nouns discussed
Here is the correction:
Common Errors using the Present Simple Passive
- Make sure you practise the passive so you know exactly how to use it.
Also, as you will see from the description, it is more unusual to comment on who or what is doing the action so the ‘by….” phrase is often excluded.
- Singular or Plural
Notice these examples are incorrect.
Another example is using countable and uncountable nouns.
The pizza dough are ready The pizzas are ready.
This is a really common mistake In Task 1 writing!
Here are the corrections:
The pizza dough is ready (the material)
The pizzas are ready (the individual pizzas)
Finally, check your Essay
Ideally, you need to allow 3 to 4 minutes at the end of the test to check and improve your writing.
Often students don’t do this because they spend the while 20 minutes writing.
It is far better to write for about 15 minutes and allow 5 minutes to check and improve your writing.
From my experience the points you should check for are:
- Are there any obvious spelling or punctuation errors?
- Are the verbs the correct tense?
Additionally, you should consider these questions, but if you followed my planning advice you should be ok.
- Do the verbs agree with the subject?
- Does the process make sense? Does it follow the visual?
- Is there any repetition in vocabulary?
- Could this be improved with synonyms?
- Have I written over 150 words?
- Have I organised the text into at least 3 paragraphs?
- Have I noticed only the obvious features from the diagram?
- Have I included the prominent features in the overview?
- Have I NOT included my personal opinion?
Once you have done this, be proud of the final product!
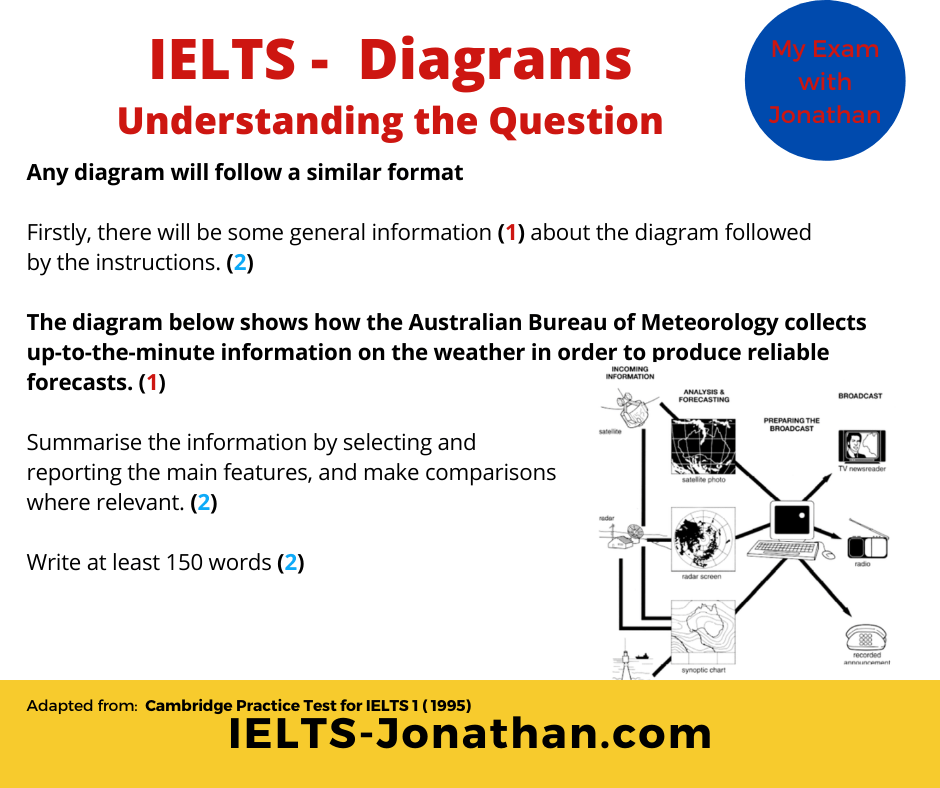
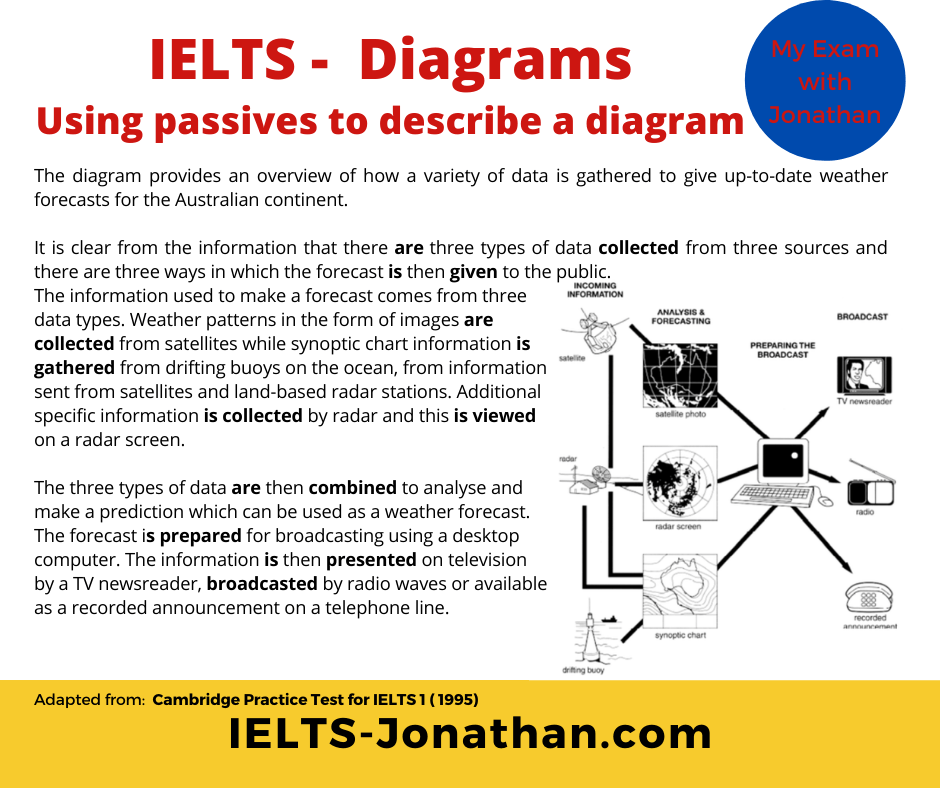
The diagram below shows how the Australian Bureau of Meteorology collects up-to-the-minute information on the weather in order to produce reliable forecasts.
Write at least 150 words.
Here’s my sample.
Sample Answer Diagrams.
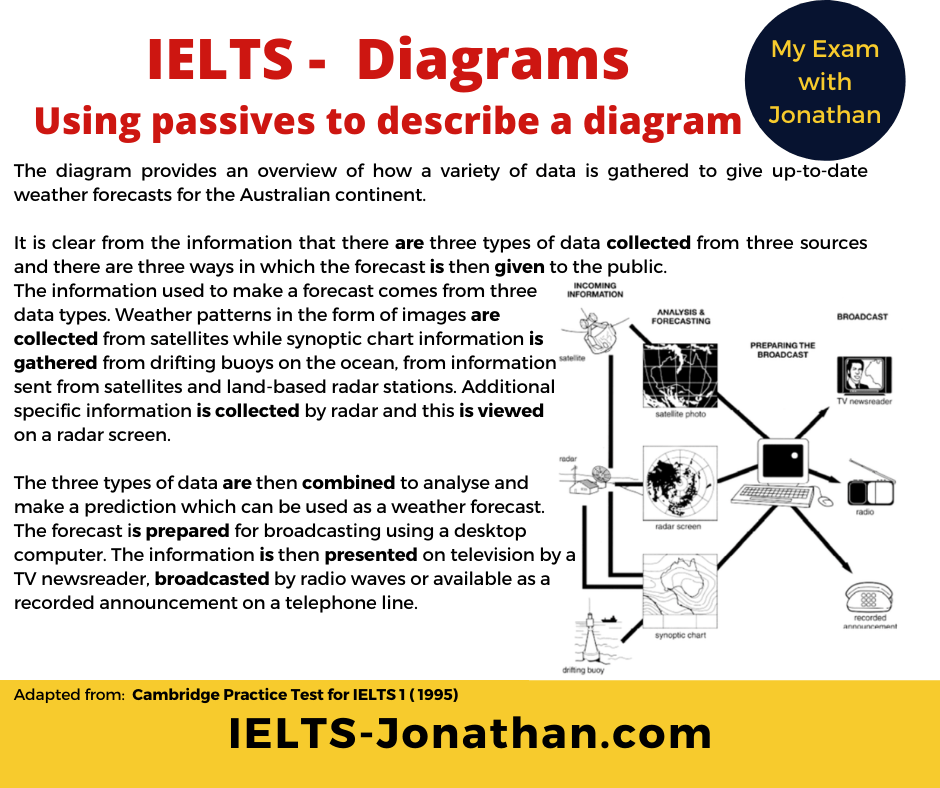
The diagram provides an overview of how a variety of data is gathered to give up-to-date weather forecasts for the Australian continent.
It is clear from the information that there are three types of data collected from three sources and there are three ways in which the forecast is then given to the public.
The information used to make a forecast comes from three data types. Weather patterns in the form of images are collected from satellites while synoptic chart information is gathered from drifting buoys on the ocean, from information sent from satellites and land-based radar stations. Additional specific information is collected by radar and this is viewed on a radar screen. The three types of data are then combined to analyse and make a prediction which can be used as a weather forecast.
Next, the forecast is prepared for broadcasting using a desktop computer. After that, the information is then presented on television by a TV newsreader, broadcasted by radio waves or available as a recorded announcement on a telephone line.
Word Count 171
I hope you found this article useful and good luck with your preparation.
Please leave a comment for a reply.
I’m Jonathan I’ve taught IELTS and University English in more than a dozen universities and schools around the world. I’m a parent, traveller and passionate about language teaching and helping students achieve their dreams. Whilst living in Austria or working in Asia, I run IELTS courses to help students get to where they want to be. If you are serious about IELTS, connect with me to see how I can help you. The Best Approach to Task 2 Writing Paragraphing in Task 2 Writing Writing – Benefits of a Foreign University Education





Was this helpful? Leave a comment :)